
How to view dataset request metrics
The HDA POC Dashboard not only allows you to view the list of data requests in different statuses but it also gives an overall picture of all the requests received represented in a pie chart displayed on the right hand panel of the dashboard.
Depending on the number of data requests in different statuses, the pie chart should display:
The number of new data requests you have received (Submitted)
The number of data requests currently being reviewed by you (Review in Progress)
The number of data requests for which In-Principle Approval was granted and pending release of the dataset(s) (In-Principle Approval)
The number of datasets requests that are awaiting additional information from the data requestor (Modifications Requested)
The number of data requests that have been approved and distributed by you (Data Released)
The number of data requests you denied (Denied)
The number of data requests that have been withdrawn by the data requestor (Withdrawn)
The number of data requests that have been discontinued as agreed between you and the data requestor (Discontinued)
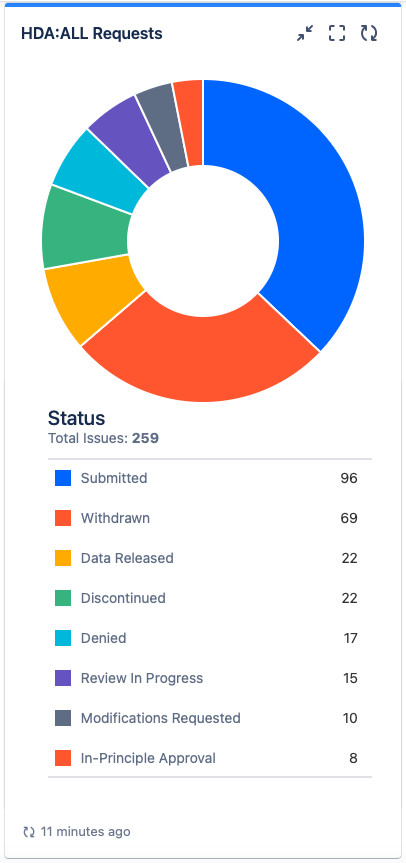
Figure 1. HDA Data Request metrics
If a Status is not displayed on the chart, this means you don't have issues in that status.