
How to manage HDA Dashboards
Health Data Australia Dashboard is managed by the HDA project administrators. Please contact them if you have suggestions or questions.
How to add an existing dashboard to your "Favourite Dashboards" list
Login to Jira at https://ardc-datarequest.atlassian.net/ .

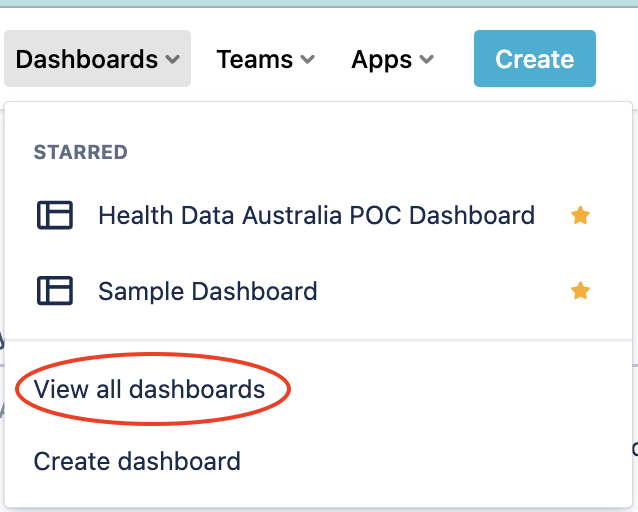
At the top menu click on Dashboards then select View all dashboards.
In the Search box, enter the name (or search term) of the dashboard you are after (i.e. POC). Hit enter to start searching.
All the dashboards matching your search criteria will be displayed for all projects you have access to will be displayed.
Click on the "star" beside Health Data Australia POC Dashboard title.
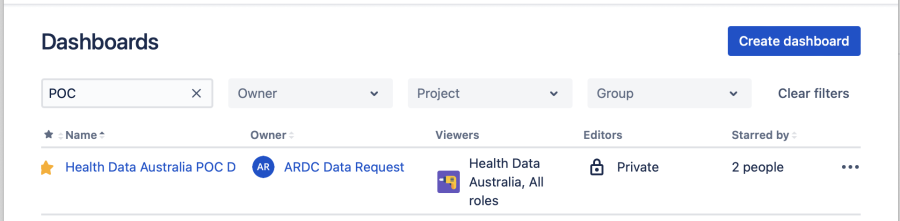
Once selected, the star shape should change its colour to yellow which indicates that the dashboard is already in your favourites list and should always be one of the selections in your dashboard list when you log in to Jira.
You can use the different filters available (Owner, Project, Group) to narrow down your search results when searching for a dashboard.
How to add your own personal or private filter
A lot of dashboard widgets are based on saved filters therefore it is important to understand how to create a filter. Filters can be private or personal or shared with certain people or role or groups.
Once logged in to Jira, go to the Filters > Advanced issue search or Search > Advanced issue search
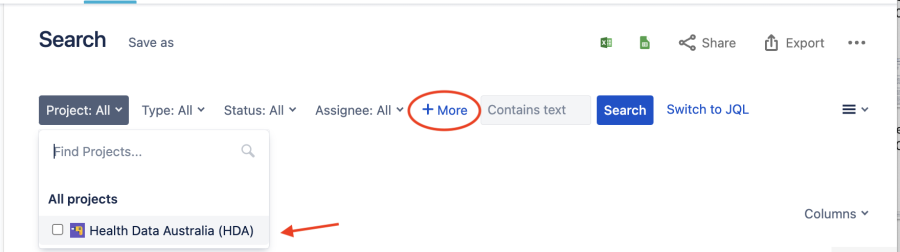
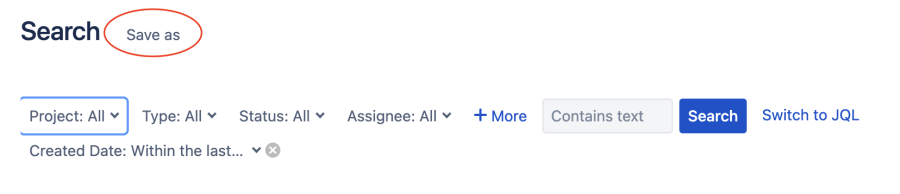
The Search window be displayed. By default, the basic search will be displayed. Filter your search results according to your requirements. Choose the project, issue type, status, or any specific search term, as necessary. You may add more fields to include in your search criteria by clicking + More.
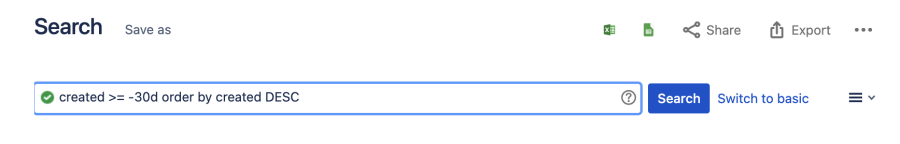
You can do JQL search if you have a more complicated search. Click on Switch to JCL to do this as per screenshot below.
Once you have selected your own filters, click on the Search button to display the search result.
If you are happy with the search result, go to the upper left-hand corner of the screen and then save your filter by clicking on the Save as button just beside Search
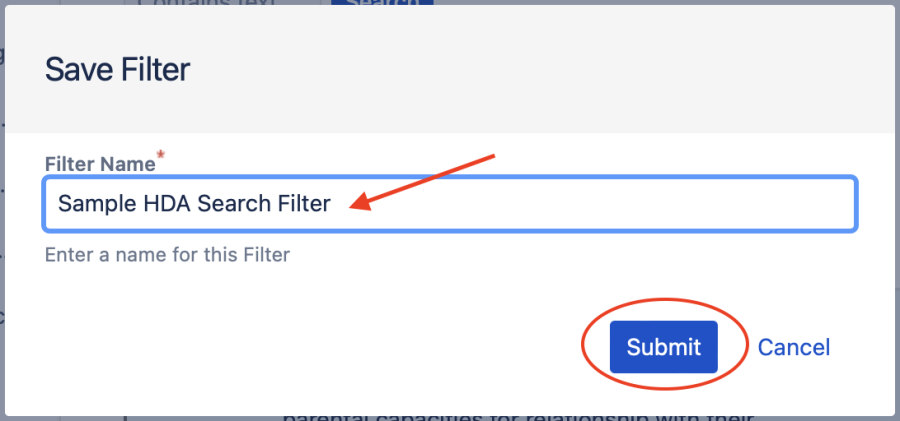
Add your filter name (choose the name that best describes it especially if you are going to share it with other users) and then click on the 'Submit' button to save.
You can share it with others by clicking the Share button on the upper right hand corner of the screen and then add the username or email address of the person you wish to share your filter with (Note: Users you share your filter with will only view the issues they have access to depending on their roles in Jira. If you think this filter should be shared with everyone, please send an email to ARDC NII Services so that the same filter can be created using a functional account for future maintenance).
Your filter is now ready to be used.
How to create a dashboard
Now that you know how to create different filters, you are now ready to create a dashboard.
Login to Jira at https://ardc.atlassian.net/ .

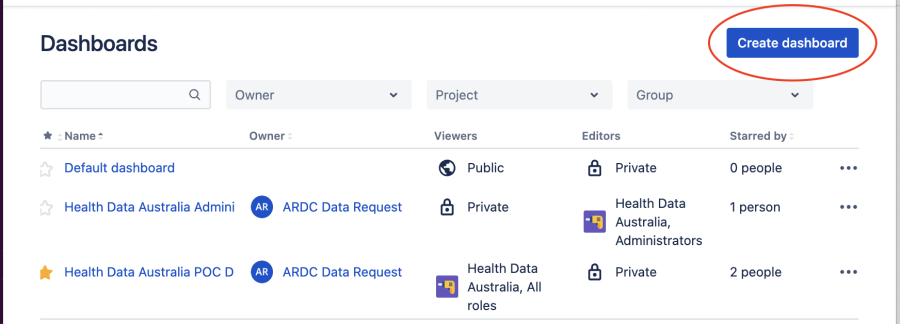
At the top menu click on Dashboards then select View all dashboards.
Click the 'Create dashboard' button on the upper right hand corner of the screen.
Type in the name of the dashboard, the description. Select the appropriate user, group or project (and role) you wish to give 'Viewer' or 'Editor' access. Click Add.
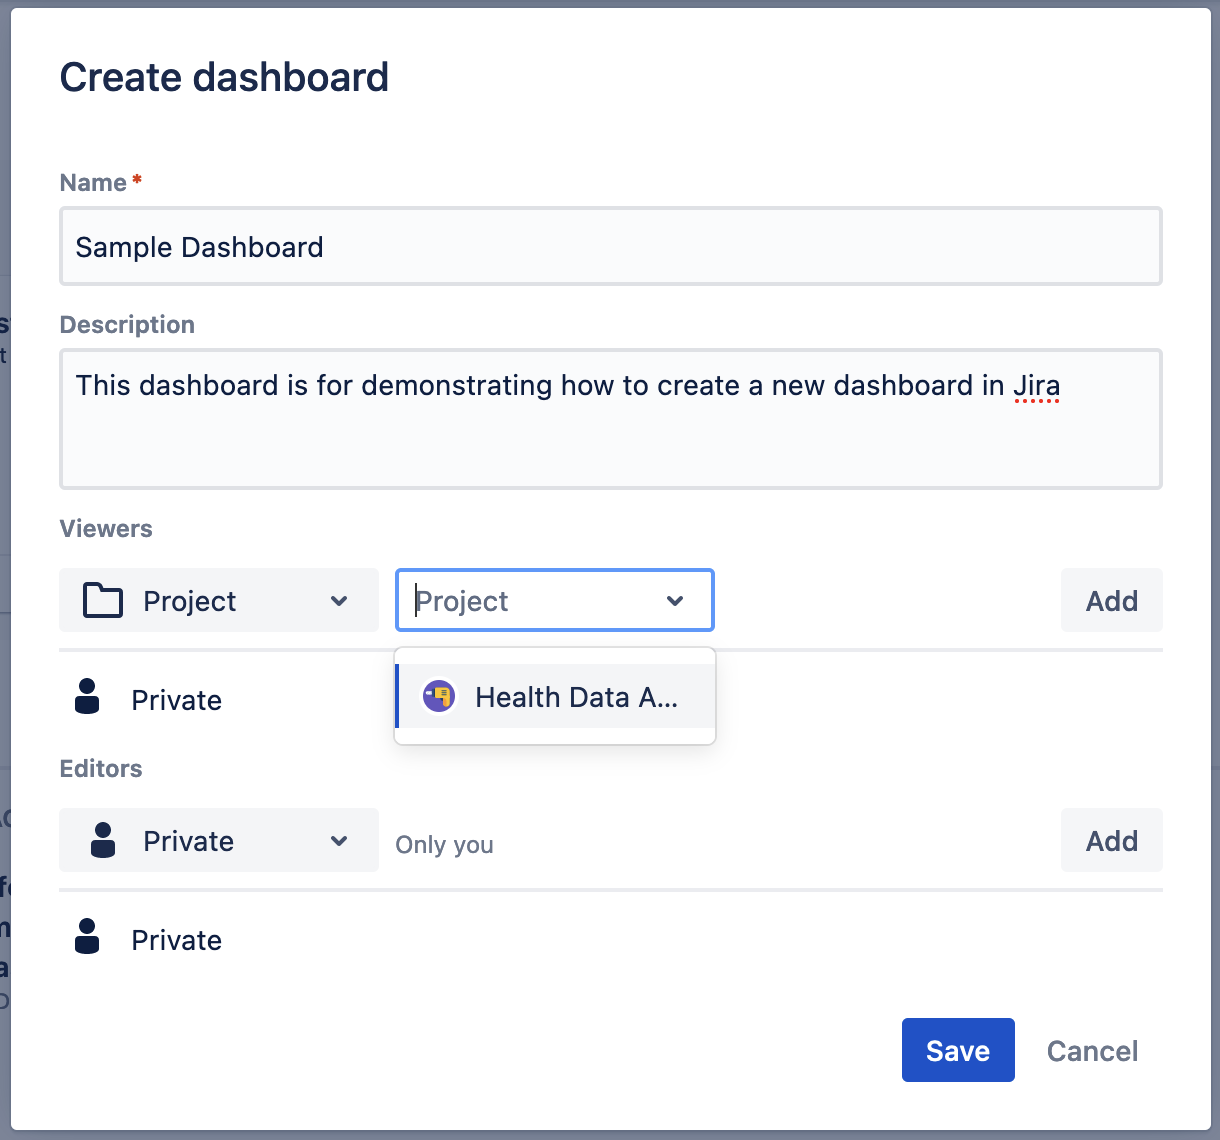
AT this stage, you are only allowed to share your dashboard to either
Project: The whole HDA project members (from all organisations)
Group: the groups you belong to (hda-pocs is your default group if you are a POC or had-watchers is your default group if you are a watcher)
My organisation: Any logged in user in HDA Data Request (this option only becomes different from the HDA Project if there are other projects you have access to other than HDA available. At this stage, there is only 1 project).
Click Save when you are done.
Now you are ready to add gadgets to the dashboard.
Click on Add Gadget button then select the gadget you would like to be displayed in the dashboard.
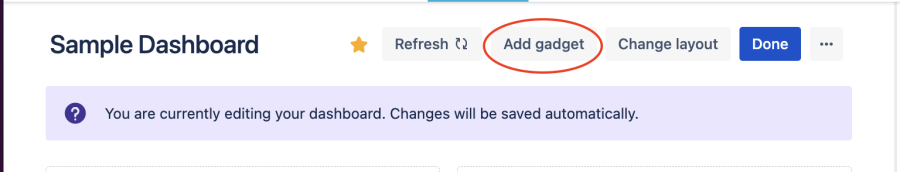
Click on the Add button to add your selected gadget it to the dashboard.
Follow the sample instructions below to add a gadget to your dashboard.
Example: How to add a 'Filter Results' gadget:
Search for 'Filter Results' and click 'Add'.
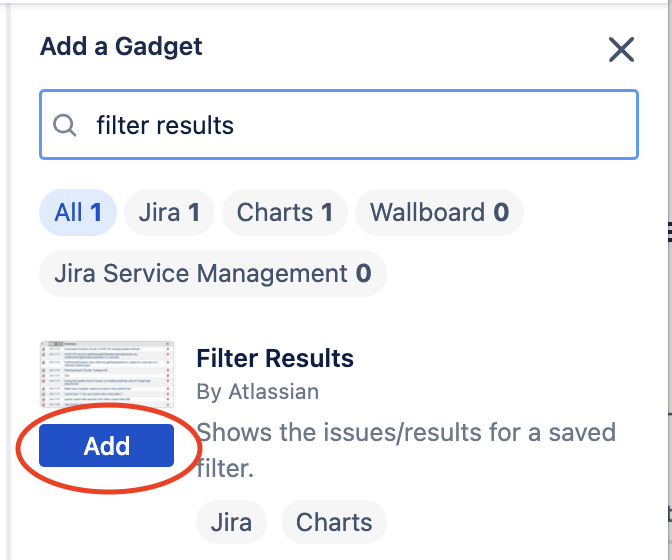
The gadget configuration window will be displayed
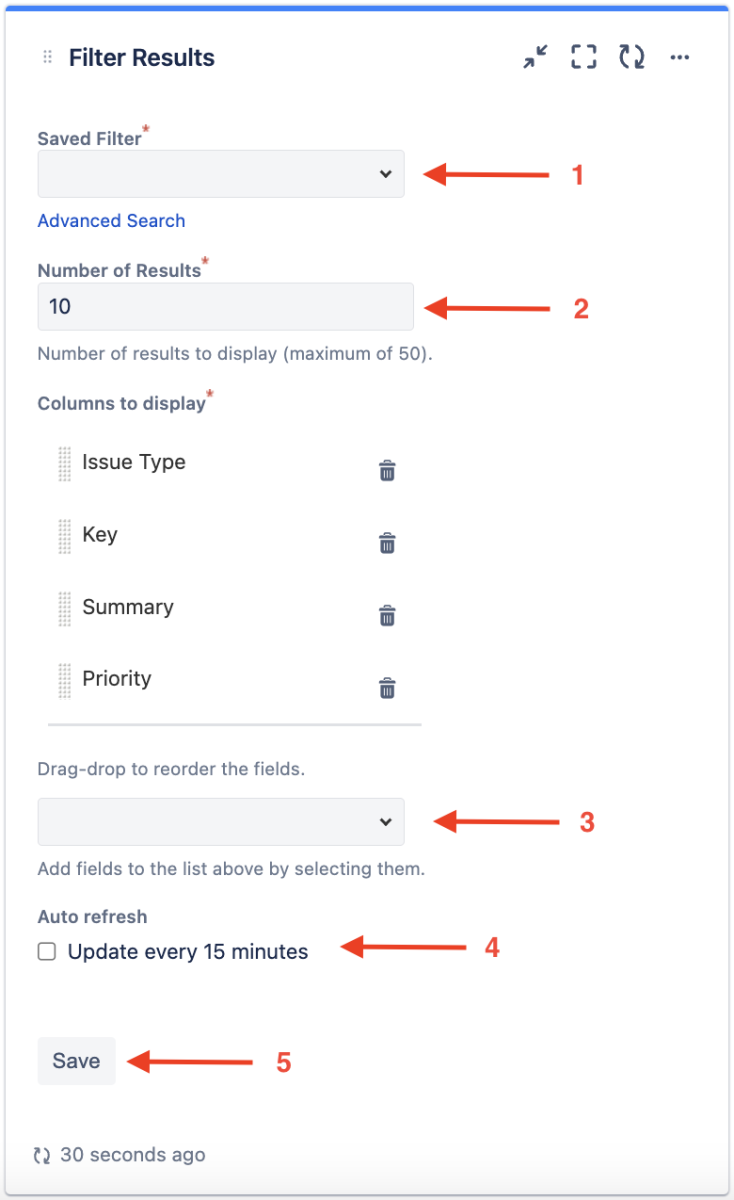
Saved filter - Search for the filter you just created or any existing filter.
Number of results - this defines the number of rows/entries that will be displayed in the gadget
Columns to display - you have the flexibility to customise which fields you wish to display in columns by adding them using the drop-down list provided.. You can also re-order the columns as you wish.
There is an option to do auto-refresh but this is not necessary.
click Save when done.
How to update or edit a dashboard
Please take note that you are only able to update or edit dashboards that you created or you own. If you wish to suggest edits to the global HDA POC Dashboard, please send an email to ARDC NII Services team.
Login to Jira at https://ardc-datarequest.atlassian.net/ if you are not already logged in
At the top menu click on Dashboards then select View all dashboards (see Fig 1.1) if the dashboard you wish to edit is not in your favourites list else, directly go to the dashboard you wish to edit by clicking on its name.
On the upper right hand corner of the screen, click the Edit button.
Editing a gadget
Go to the gadget that you wish to edit. Click on the ellipsis icon on the upper right and select Configure as per below.
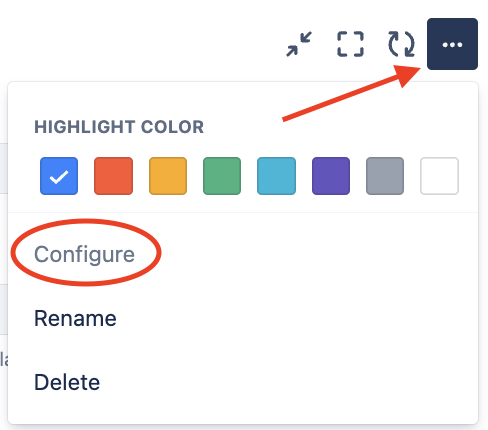
Edit/change the settings and Save it when done (refer to an example above).
If you are done with all the edits you wanted to do in the dashboard, click Done to exit edit mode.
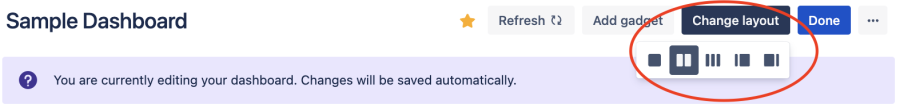
Editing or changing the dashboard layout
Click on Change layout button on the top right corner of the screen. The layout options will be displayed as below. Select the layout you prefer.
You can change the layout of the dashboard and all existing gadgets will not be impacted expect how they are displayed on the screen so feel free to change the layout as you please.
You can drag and drop the gadget to an area on the dashboard that you want them displayed.
When you are happy with the display, click Done to exit edit mode.